Let Octotor do the work.
Setup is done — Octotor is installed, licensed and talking to your computers. This guide automates what you did by hand and turns on the watching: collection on a schedule, monitoring and alert rules, notifications that reach you, and access locked down for daily use.
What tours are. A tour walks you through a real task, click by click, on the pages of a live demo copy of Octotor. It opens in a new tab and changes nothing on your own installation. Every step in this guide that has a matching tour shows a Tour button next to its title, like the one here. Click it to watch the step done in the demo before you do it yourself. Try it with the first step:
Tour — Schedule your first taskContents
1Put the collectors on a scheduleTour
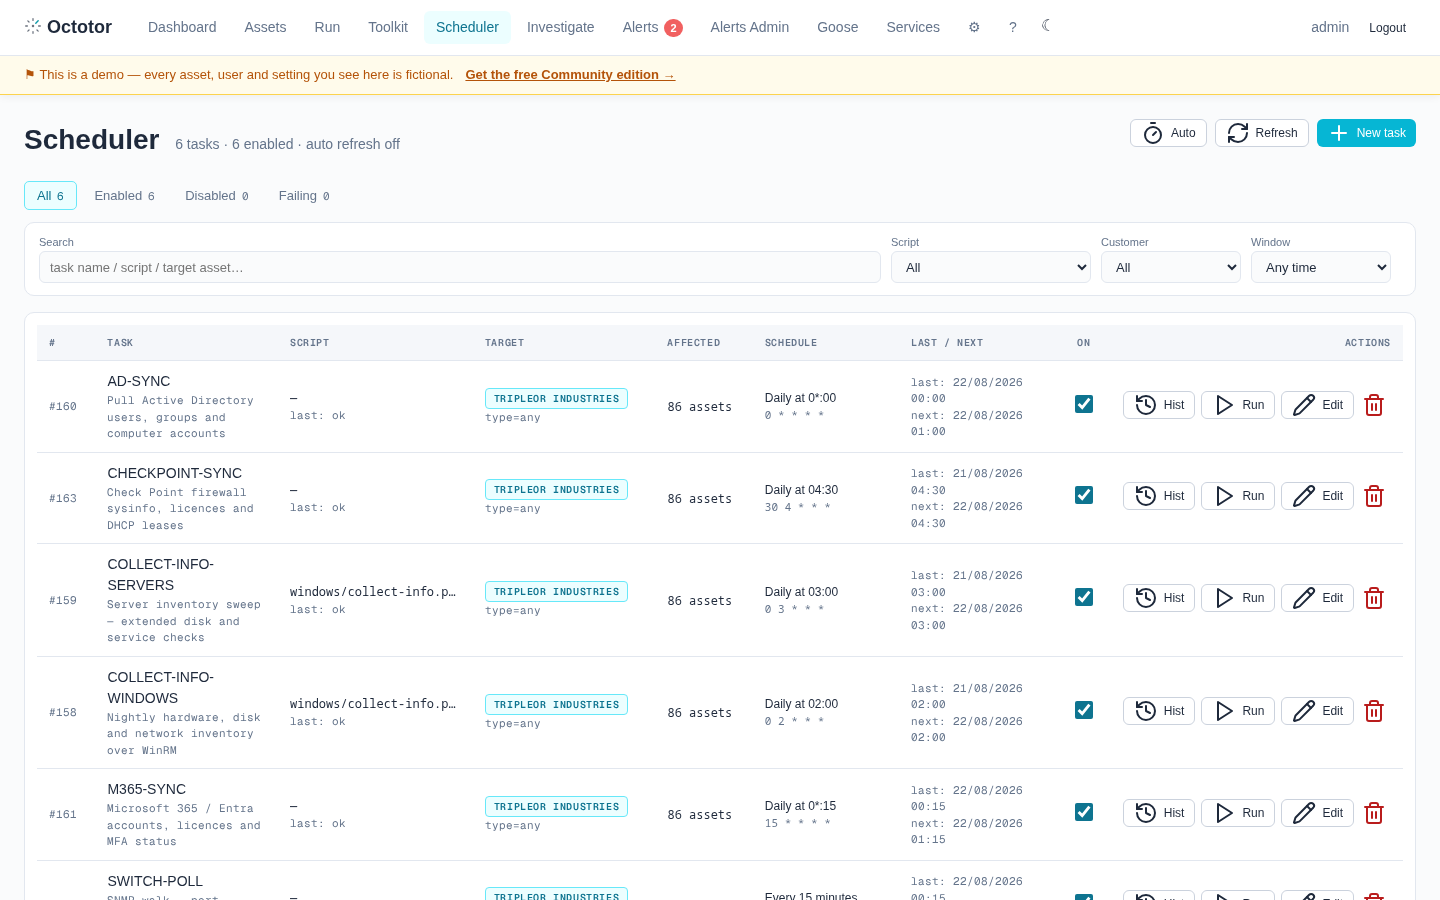
Everything you did by hand at the end of the Setup Guide, the Scheduler now does for you, on a fixed schedule. You'll create four tasks — each one below, click by click:
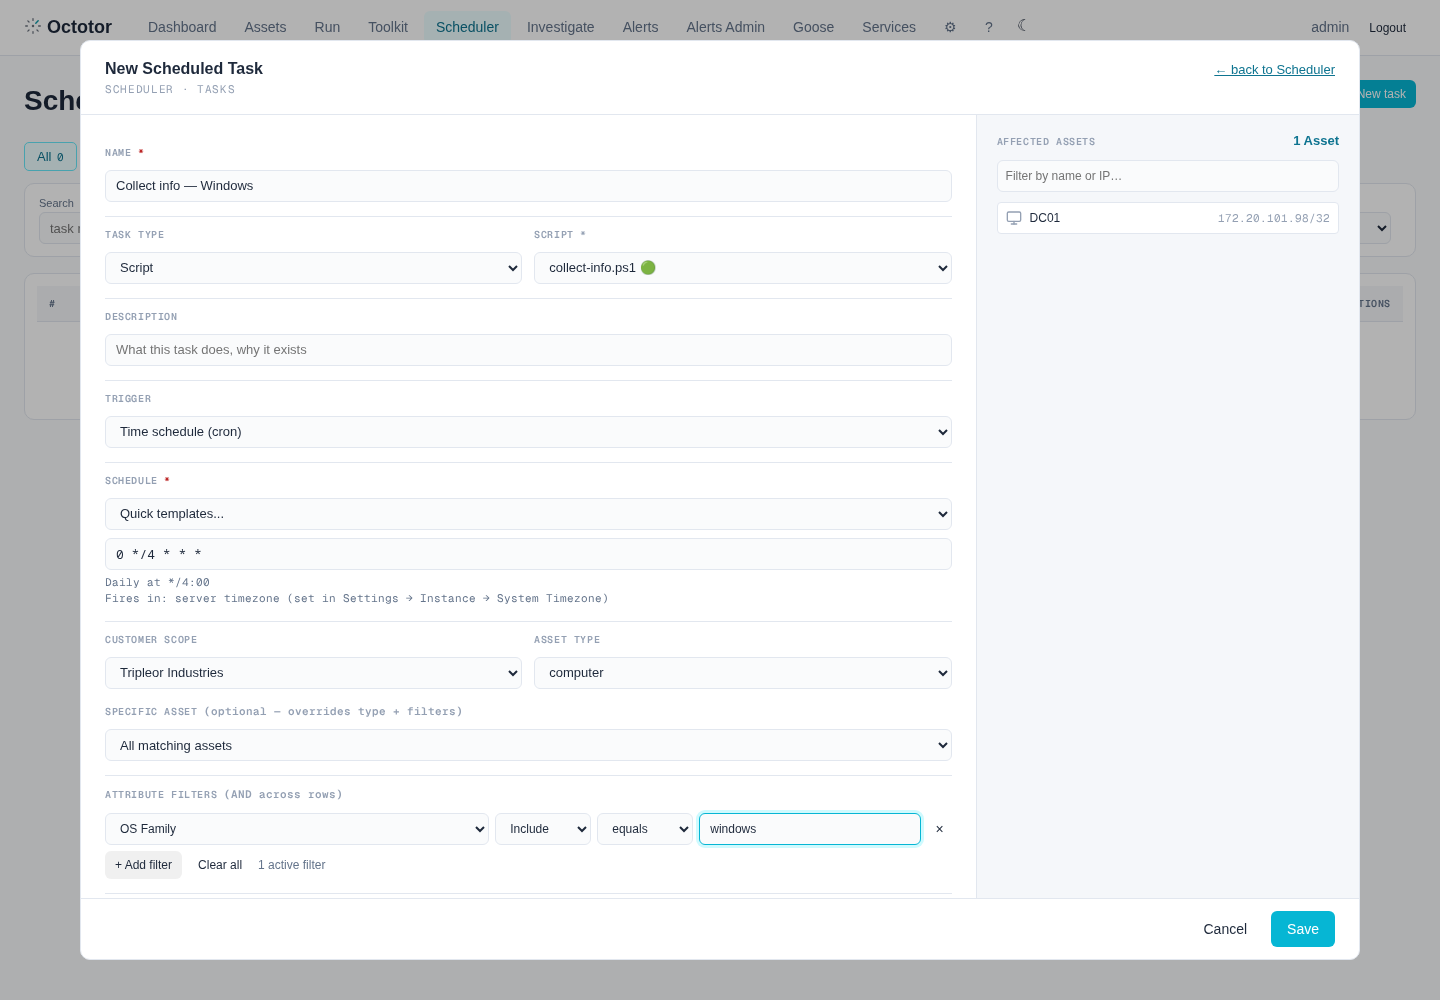
Task 1Windows details, every 4 hours
What it doesruns the Windows collector on every Windows computer, every 4 hours — refreshing each machine's hardware, disks, memory, installed software and logged-on user.
Why create itthe details you collected once in the Setup Guide start going stale the moment you collect them. This task keeps every machine's page current without you touching anything — and the disk alerts you'll create in Step 2 rely on this fresh data.
- Open Scheduler and click + New task (top right).
- Name — Collect info — Windows.
- Task type — Script. Under Script, pick collect-info.ps1 (the Windows collector).
- Trigger stays on Time schedule (cron). Under Schedule, open Quick templates… and pick Every 4 hours — the schedule field below fills in by itself, and the form shows in plain words when the task will fire.
- Customer scope — pick your customer. Asset type — computer.
- Under Attribute filters, click + Add filter and set the row to: OS Family | Include | equals | windows. This one filter makes the task cover every Windows computer — including ones discovered later.
- Check the Affected assets panel on the right — it lists exactly which computers this task will visit. Confirm the list matches what you expect before saving.
- Click Save. The task appears in the list, enabled, with its next run time.

Task 2Linux details, every 4 hours
What it doesruns the Linux collector on every Linux computer, every 4 hours — refreshing each machine's hardware, disks, memory, installed software and logged-on user.
Why create itthe same reason as Task 1 — your Linux machines' pages stay current, and the alert rules in Step 2 work on fresh data.
- Open Scheduler and click + New task.
- Name — Collect info — Linux.
- Task type — Script. Under Script, pick collect-info.sh (the Linux collector).
- Trigger stays on Time schedule (cron). Under Schedule, open Quick templates… and pick Every 4 hours.
- Customer scope — pick your customer. Asset type — computer.
- Under Attribute filters, click + Add filter and set the row to: OS Family | Include | equals | linux.
- Check the Affected assets panel — it should list your Linux machines.
- Click Save.
Task 3AD computer discovery, once a day
What it doesasks your Domain Controller, once a day, for the full list of computers in the domain.
Why create itany machine that joins the domain shows up in Discovery for your approval by itself — nothing on the network stays invisible.
- Open Scheduler and click + New task.
- Name — AD discovery — computers.
- Task type — Script. Under Script, pick collect-ad-computers.ps1.
- Trigger stays on Time schedule (cron). Under Schedule, open Quick templates… and pick a daily slot — for example Daily 06:00.
- Customer scope — pick your customer.
- Under Specific asset, pick your DC. This task runs on the DC only — the specific asset overrides the type and filter settings.
- Check the Affected assets panel — it should list just the DC.
- Click Save.
Task 4AD user discovery, once a day
What it doesadds your people — every AD user appears under Assets → Users, with account state, groups and last logon.
Why create ityou see disabled accounts, stale logons and group membership without opening AD.
- Open Scheduler and click + New task.
- Name — AD discovery — users.
- Task type — Script. Under Script, pick collect-ad-users.ps1.
- Trigger stays on Time schedule (cron). Under Schedule, open Quick templates… and pick a daily slot — for example Daily 06:00.
- Customer scope — pick your customer.
- Under Specific asset, pick your DC.
- Check the Affected assets panel — it should list just the DC.
- Click Save.
Before the Windows-wide task can reach every machine, WinRM must be enabled across the fleet — one group policy does it: Enable WinRM with Group Policy.
2Turn on monitoring and the first alert rules
Step 1 gathers facts; this step makes Octotor watch those facts and warn you when something crosses a line — a server that stops answering, a disk that's filling up — before a user calls. Two parts: tell Octotor which computers to watch, then what to warn about.
Watch your serversTour
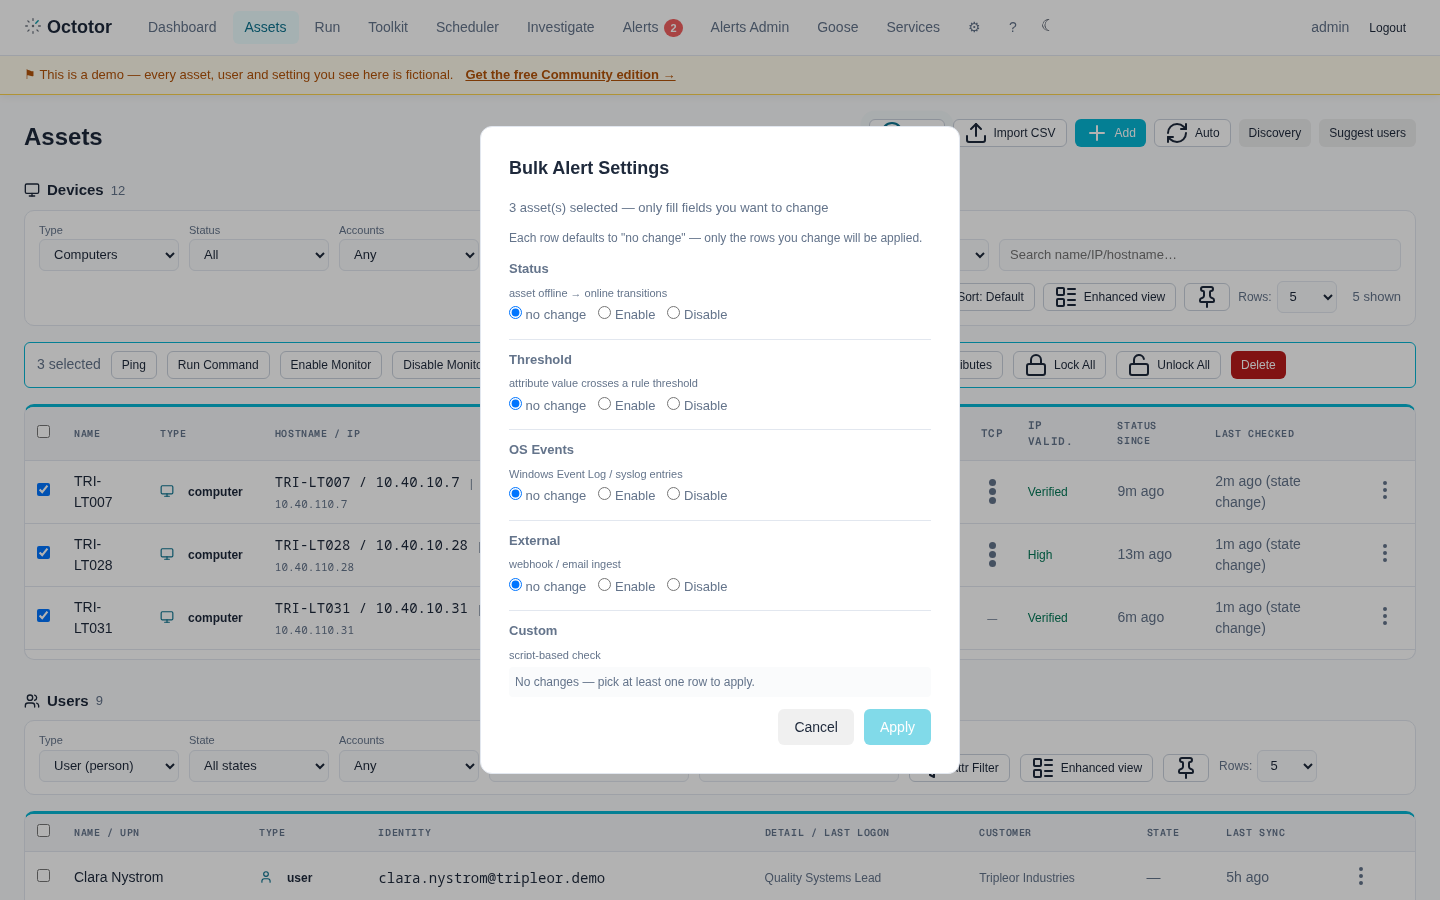
What it doesStatus alerting tells you when a machine stops responding. Threshold alerting lets value rules (like "disk almost full") apply to that machine.
Why enable italert rules only cover machines that have these settings enabled — a rule you create in the next section does nothing for a server that is not being watched. Enable both settings on every server you want Octotor to monitor.
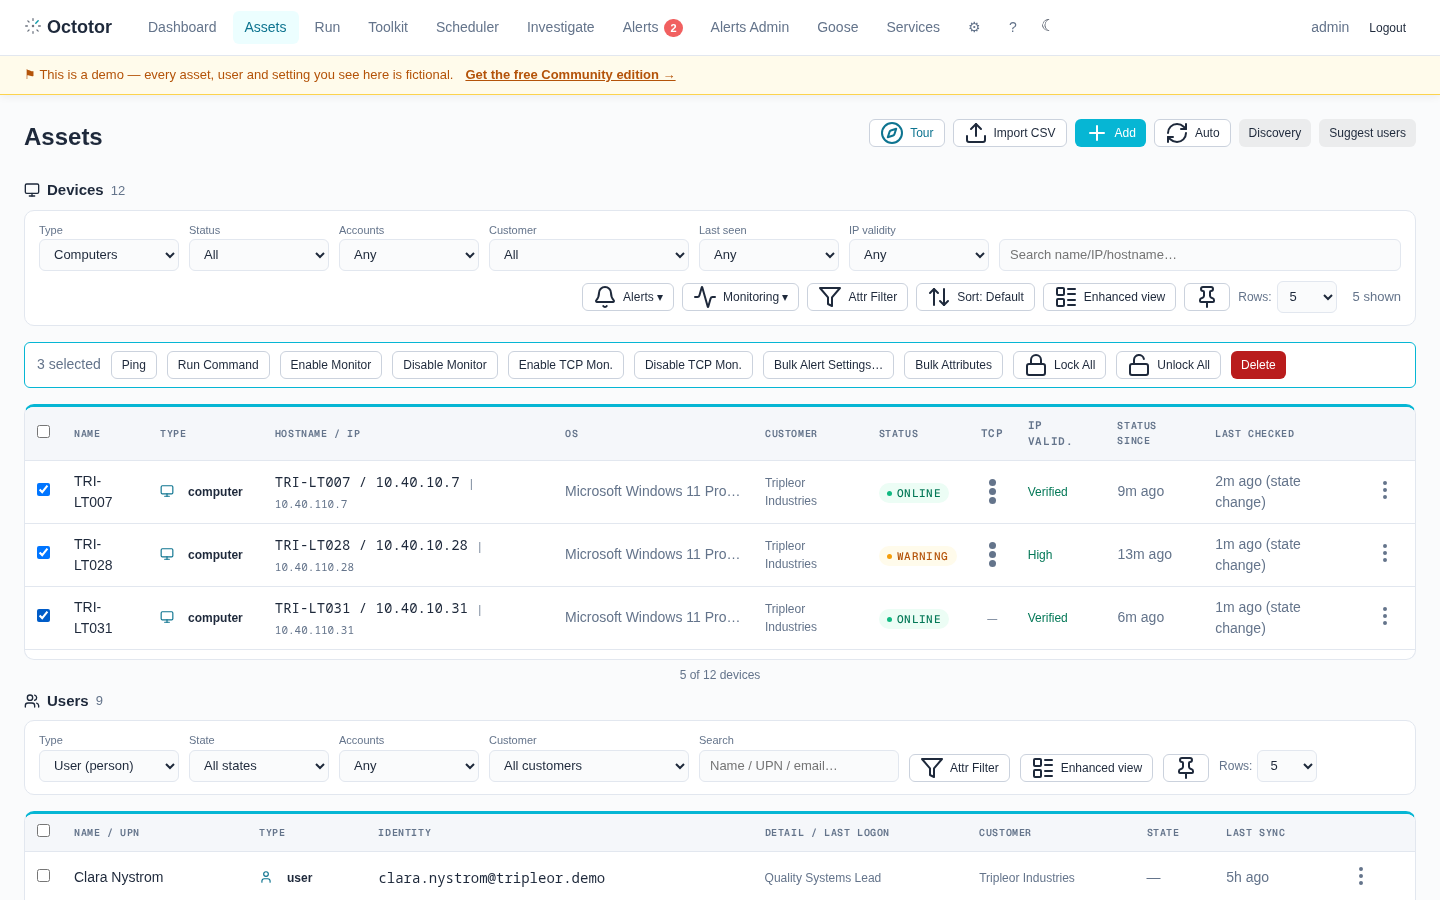
- Open Assets and select the checkbox on each server you want to monitor (or filter by type first, then select the top checkbox to choose them all).
- An action bar appears above the list — click Bulk Alert Settings…
- Set Status to Enable and Threshold to Enable, then click Apply.
Add two starter rules
A rule watches one collected value on every machine in its scope, and opens an alert the moment the condition holds. The values it checks are the ones your collector tasks from Step 1 refresh. A disk filling up is the most common problem that gives no warning of its own — so start with one rule for the system drive and one for the secondary disk.
Rule 1Low free space on the system driveTour
What it doesopens a warning alert the moment any monitored computer reports 10% or less free space on its system drive — the C: drive on Windows, the root filesystem on Linux.
Why create itthe system drive holds the operating system itself — when it fills up, updates fail, temp files can't be written and the machine eventually stops working. Catching it at 10% leaves you time to free space before anything breaks.
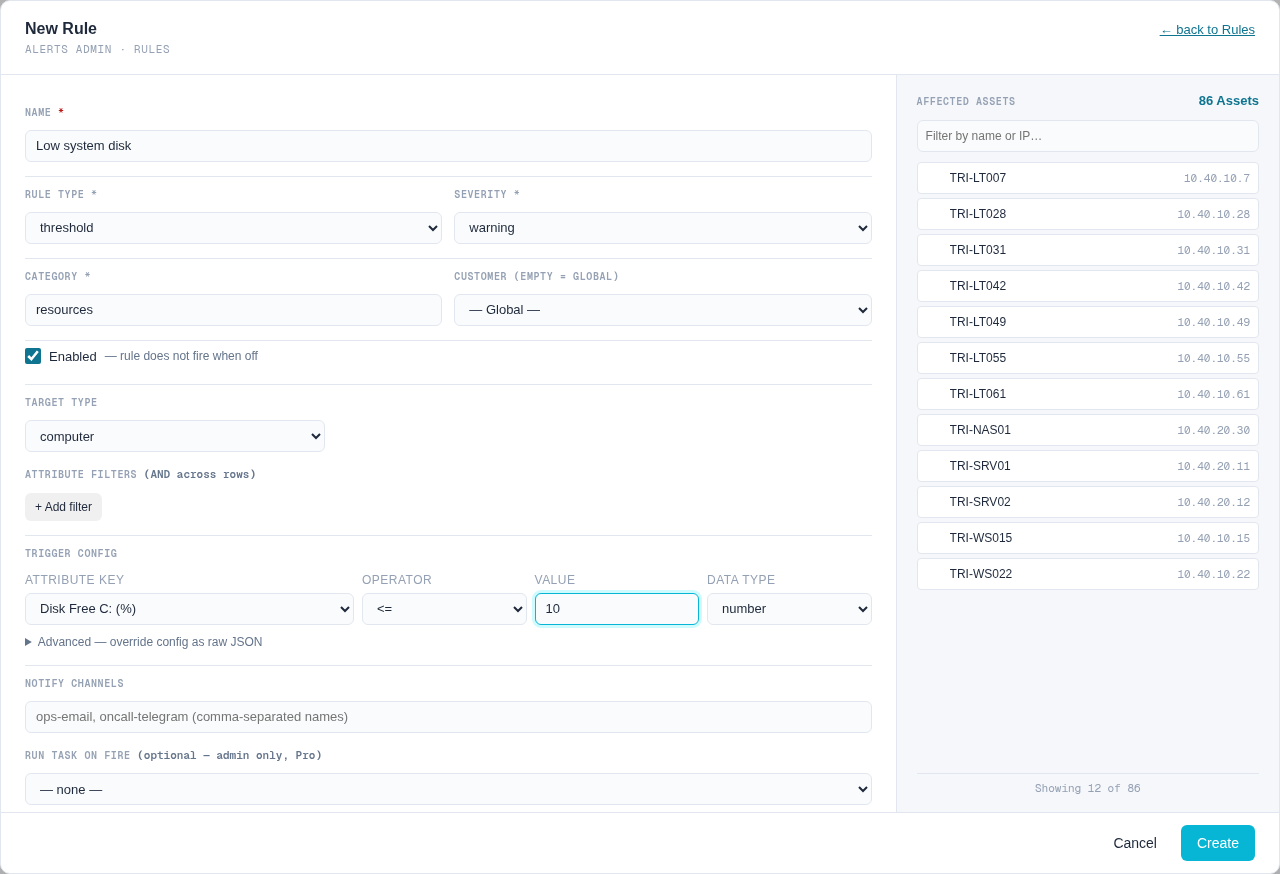
- Open Alerts Admin and click + New rule. The New Rule form opens.
- In Name, type Low system disk.
- Set Rule type to threshold and Severity to warning.
- In Category, type resources. Leave Customer on — Global — so the rule covers every customer.
- Leave Enabled checked.
- Set Target type to computer. You can leave the attribute filters empty — computers that haven't reported this value are simply never matched.
- Under Trigger config: set Attribute key to Disk Free C: (%) (despite the C: name, Linux computers report their root filesystem under this same attribute), Operator to <=, Value to 10, and leave Data type on number.
- Check the Affected assets panel on the right — it lists the machines this rule will watch. Confirm your servers appear there.
- Click Create.
Rule 2Low free space on the secondary disk
What it doesopens a warning alert the moment any monitored computer reports 10% or less free space on its secondary disk — the D: drive on Windows, the second data disk on Linux — where servers typically keep data, databases or backups.
Why create itdata disks fill up faster than system disks — a growing database or a backup folder can consume the last 10% in days. This rule covers the disk that Rule 1 does not.
- In Alerts Admin, click + New rule again.
- In Name, type Low secondary disk.
- Set Rule type to threshold and Severity to warning.
- In Category, type resources. Leave Customer on — Global —.
- Leave Enabled checked.
- Set Target type to computer.
- Under Trigger config: set Attribute key to Disk Free D: (%) (Linux computers report their second data disk under this same attribute), Operator to <=, Value to 10, and leave Data type on number.
- Check the Affected assets panel — machines with only one disk are simply never matched, so it is safe for this rule to cover all computers.
- Click Create.
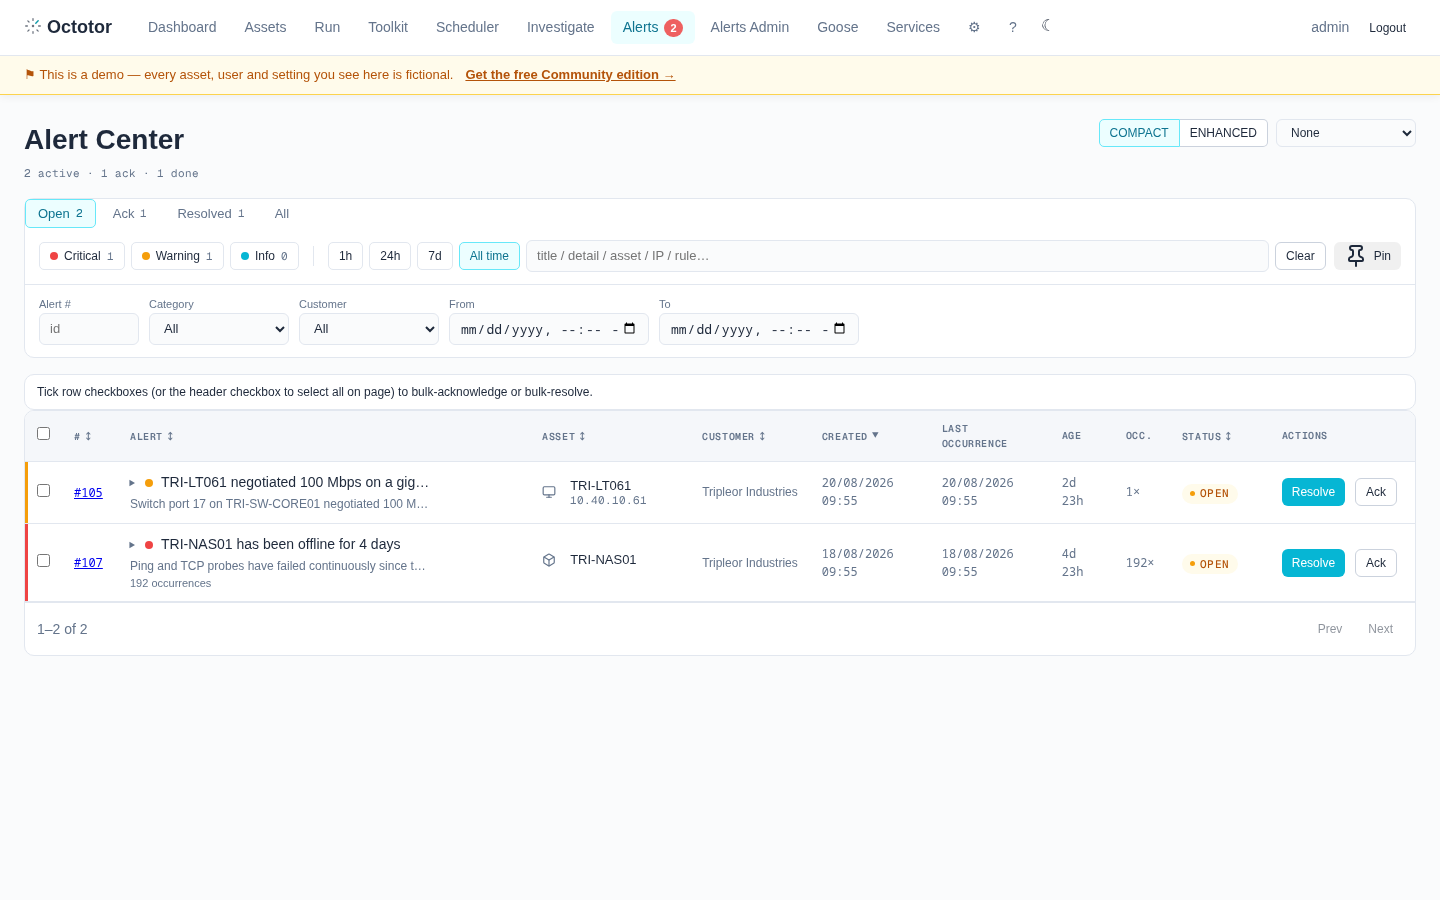
When a rule fires, the alert appears on the Alerts page (the Alert Center) — with severity, history, and buttons to acknowledge or close it:
3Get notified: email, Telegram or webhookTour
What it doesa channel sends every alert to a place you already watch — your email inbox, a Telegram chat on your phone, or a webhook into your chat or ticket system.
Why create italerts always appear on the Alerts page inside Octotor, but nothing tells you to go look at it. Without a channel, an alert waits until someone opens Octotor. With a channel, the alert reaches you the moment it fires. Set up at least one.
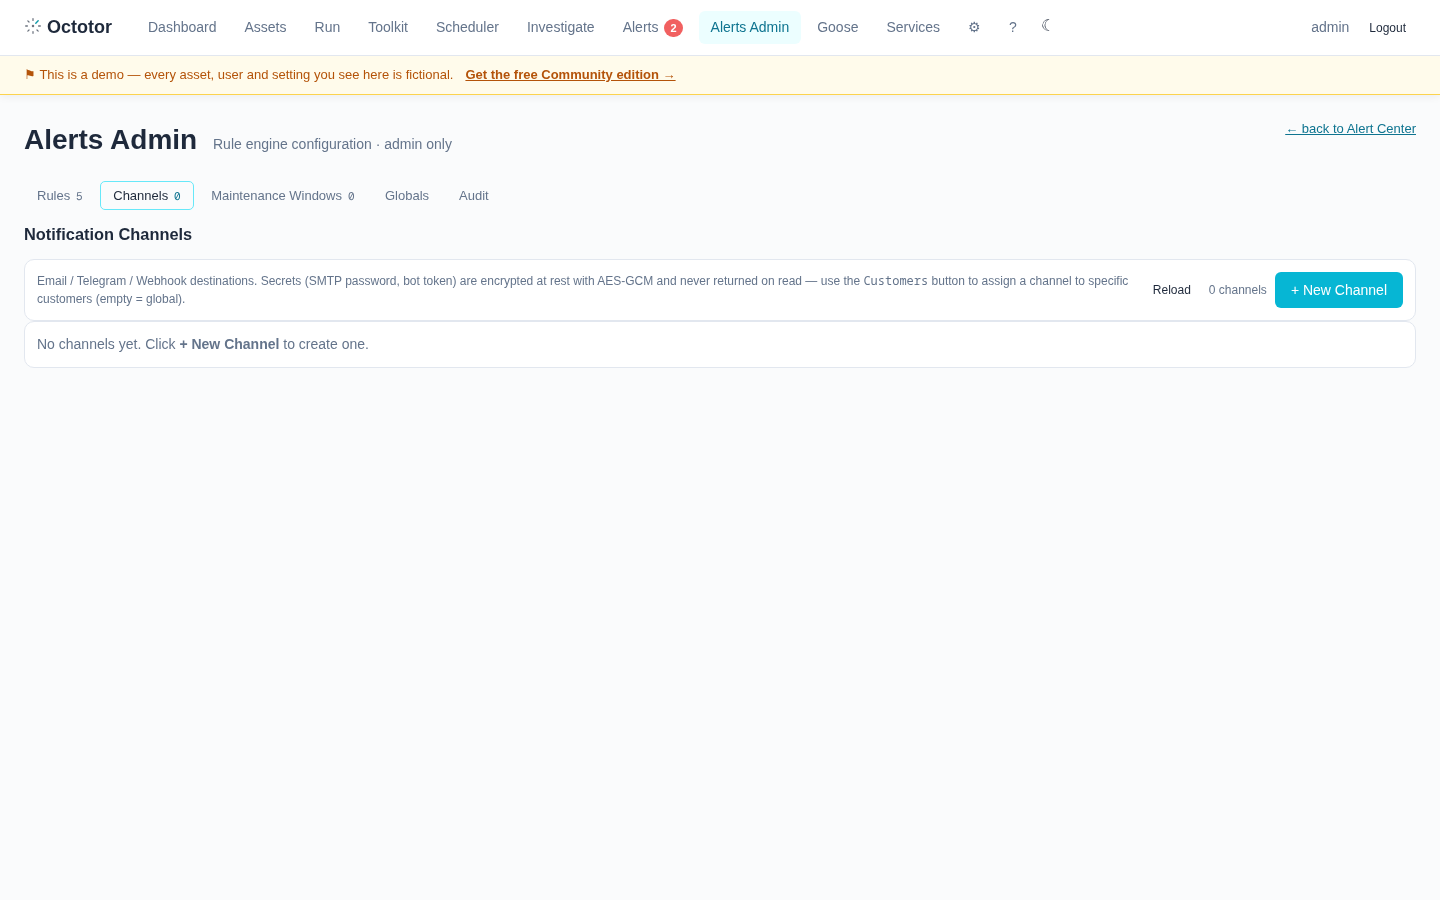
- Open Alerts Admin and switch to the Channels tab.
- Add a channel: Email (your mail server's address, login and who to send to) · Telegram (a bot token and chat ID — see below) · Webhook (a URL that receives the alert as JSON — for chat tools or ticket systems).
- Click the channel's Test send button and confirm the message actually arrives — don't skip this.
- Open your alert rules and tick this channel under Notify channels.
Telegram in short
In Telegram, message @BotFather and send /newbot — it gives you a token. Make a private channel, add your bot as an admin that can post, and put the token + chat ID into the Octotor channel. The full walkthrough with every tap is in the product Help → Alerts Admin.
4Lock down access
A fresh install has one all-powerful admin login. The two steps below replace it with personal, limited accounts you can safely hand to a team.
Step 4.1Create a login for each personTour
What it doescreates a personal login for each member of your team. Every login carries a role that sets its base level of access: a Viewer can only view, an Operator can carry out day-to-day work, and an Admin controls everything. The steps below use the Operator role, which fits most technicians; in the next step you will create a group that defines exactly which pages, scripts and credentials these logins may use.
Why create itthree months from now a server was rebooted at 02:00 and you want to know who did it. With personal logins, the audit trail on the Investigate page shows the person's name. With one shared admin login, the trail says "admin" — and answers nothing. Sharing the admin account also hands full Settings access to everyone who knows its password.
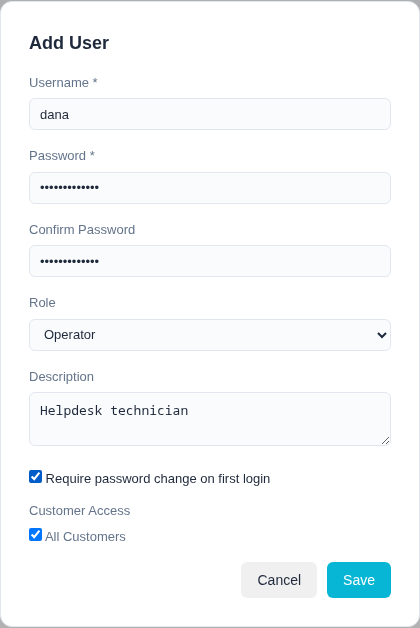
- Open Settings → Users & Access.
- Click + Add User.
- In Username, type the person's login name. Fill Password and Confirm Password.
- Set Role to Operator.
- Tick Require password change on first login — the person sets their own password the first time they sign in.
- Under Customer Access, leave All Customers ticked — or, if this person should only see some customers, untick it and tick theirs.
- Click Save.
- Repeat for each team member.
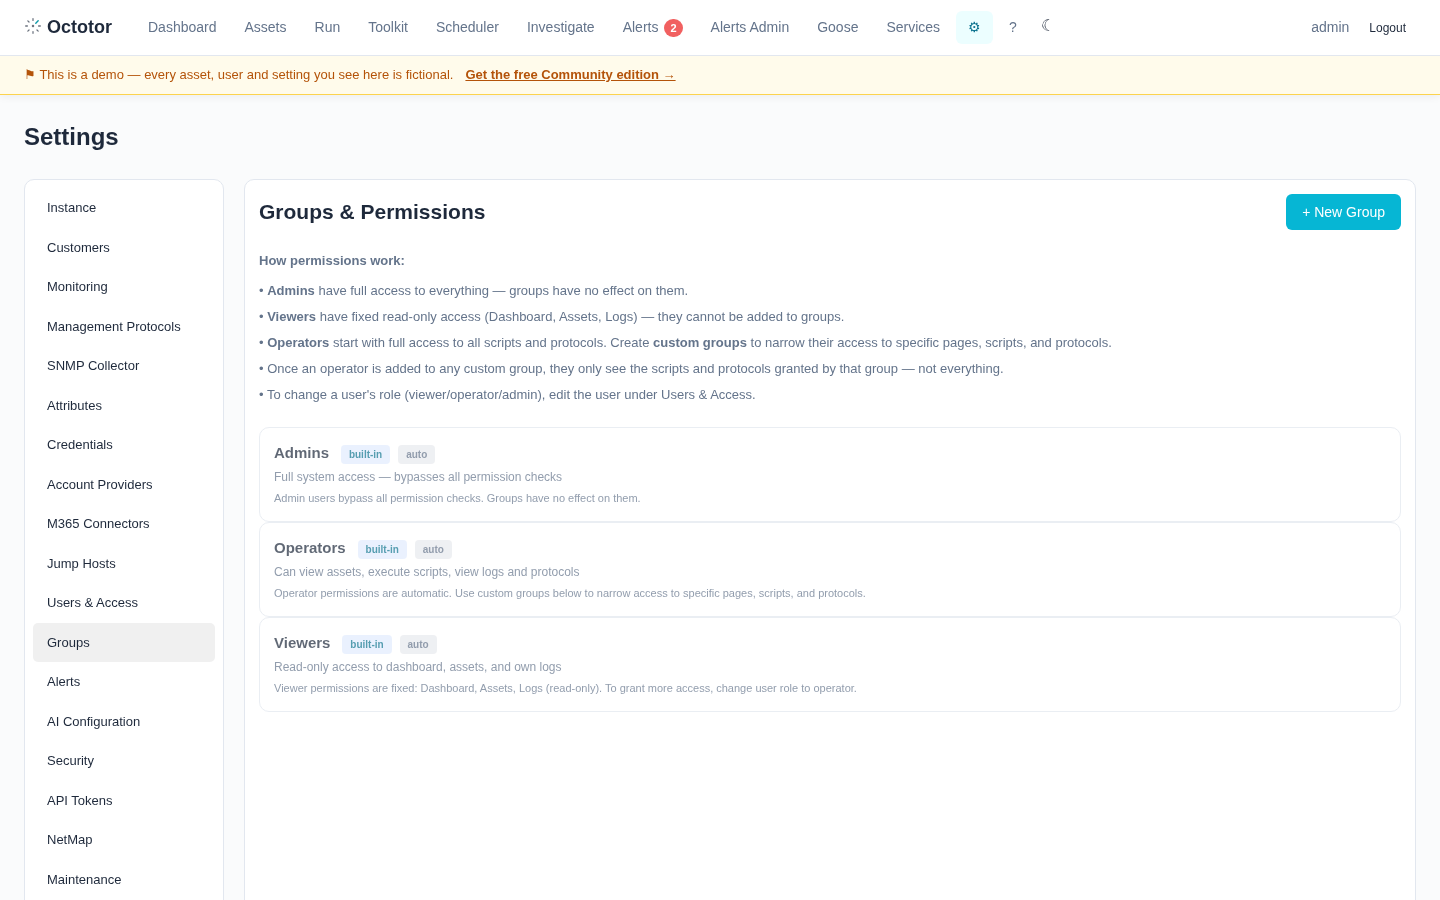
Step 4.2Create a custom groupTour
What it doescreates a permission group for day-to-day users that limits what its members can open and run: the everyday pages, the script folders you pick, and only the credentials you pick. Operators normally have access to everything on their pages — the moment an operator is placed in a group, they are narrowed to exactly what the group grants.
Why create ita technician logs in to check a slow PC. With this group in place they can see the dashboard, look at assets, run the scripts you allowed with the credentials you allowed — and nothing else. No Settings, no credential store, no scripts outside the granted folders. A mistake, or a stolen password, stops at the same line.
- Open Settings → Groups.
- Click + New Group. In Name, type operators-01. In Description, type Day-to-day technicians. Click Save.
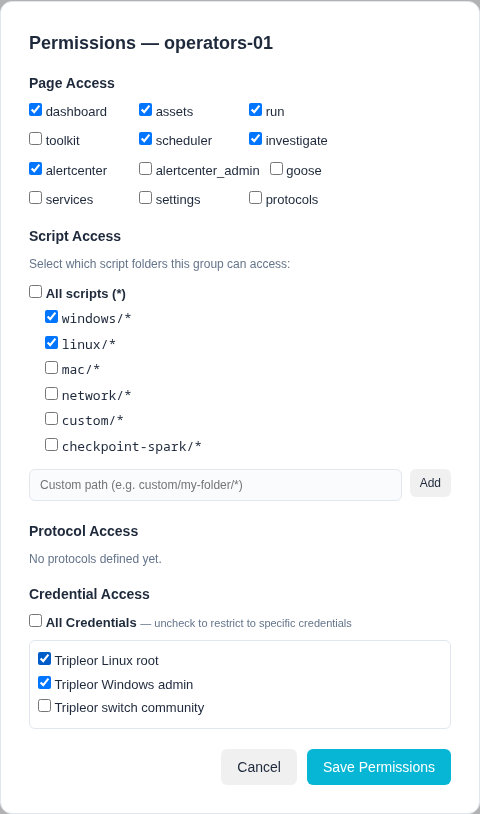
- On the new group's card, click Permissions.
- Under Page Access, tick dashboard, assets, run, scheduler, investigate and alertcenter. Leave the rest — including settings — unticked.
- Under Script Access, leave All scripts (*) unticked and tick the folders your team's scripts live in — windows/* and linux/* for the setup in this guide (add custom/* if you uploaded your own scripts).
- Protocol Access lists the step-by-step operational procedures defined on the Protocols page. A fresh install has none, so the box says No protocols defined yet — skip it. When you define protocols later, come back and tick the ones this group may use.
- Under Credential Access, untick All Credentials and tick the two credentials you created in the Setup Guide (the Windows domain credential and the Linux credential).
- Click Save Permissions.
- Back on the group's card, click Members.
- In the Add user list at the bottom of the Members window, pick the login you created in Step 4.1 and click Add. The person appears in the members table above. Repeat for each login, then click Close.
Where you end up
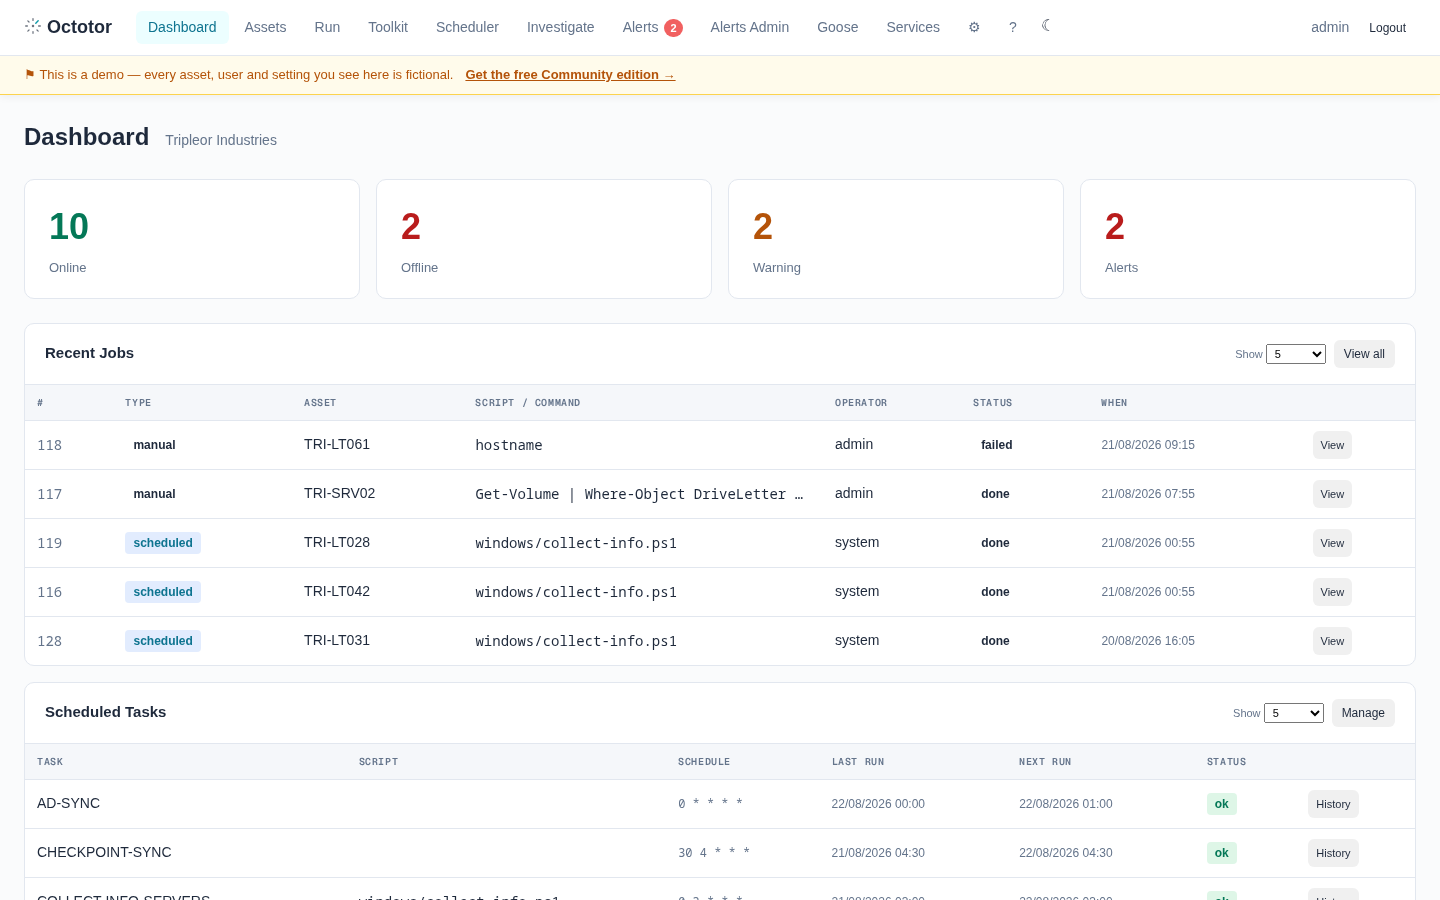
When these steps are done, Octotor runs the routine for you. The collectors refresh every machine's details on schedule, monitoring watches your servers around the clock, and the moment something crosses a line an alert reaches your inbox or phone. Your team works from personal, limited accounts — and the dashboard gives you one place to see the whole environment.
What to try next. Two short guided tours in the live demo show everyday work with the data Octotor now collects:
Tour — Track changes on a computerTour — Find computers and usersEvery environment differs — the steps here are the recommended path. The product Help (the ? button) goes deeper on every page mentioned in this guide.